Page last updated on September 7, 2021 at 11:30 am
For more information, please contact
Jill Minor, Data Analyst, City of Bloomington Utilities (Administration Division), [email protected], 812-349-3686
The Challenge
Main breaks are always a problem for any water distribution system. Vic Kelson, City of Bloomington Utilities (CBU) Director, noticed that CBU had apparently no main breaks during the initial COVID quarantine period, March through May 2020 and tasked a CBU team to use data to find out why.
The Idea
Jill Minor, CBU’s Data Analyst, made visual representations of the data to help the team generate insights and create predictive modeling. With better modeling, the team hoped that CBU could be more strategic about investment in pipe replacement and equipment.
New to her position, Jill tackled all of the available data including pipe material, location, age, as well as the chemical make-up of water at different times from the supervisory control and data acquisition system (SCADA - the hardware and software that plant operators use to control treatment processes and water distribution), plant infrastructure, customer demand, and weather patterns. She developed familiarity with a broad palette of open-source Python data visualization tools and also researched what other utilities were doing to predict water main breaks.
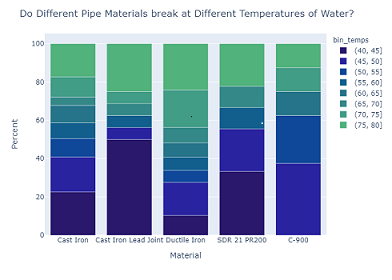
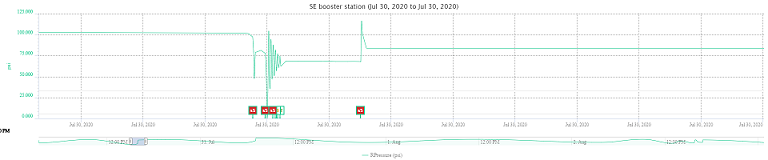
The result? The data showed that causes of water main breaks are already well known and difficult to change, like water temperature. She also found that Bloomington had similar periods in previous years without breaks and nothing stood out as particularly unique during the quarantine period, although customer demand patterns did decrease. The one factor identified in the data that we can influence is transient water pressure fluctuation - also known as water hammer.
In the case of water main break predictions, as well as many projects since then, visualizing the data by using graphs, charts, tables, and maps allows others to easily interpret the information. More generally, visualizing data clearly and effectively can help speed up discovery of solutions to problems. Presentation of visual data can help communicate ideas, progress, and other metrics in a meaningful way.
The Cost
The effort by the CBU team to explore the causes of water main breaks, and the resulting process improvement measures implemented in other divisions of CBU, occupied about 400 person hours. The new technology and software implemented to observe water hammer cost $12,000, but it will eventually be integrated into the new asset management system, and will serve multiple long-term functions. The water main break study may have been the initial benefactor of new software integration and emphasis on data visualization, but every CBU project moving forward will now likewise benefit.
The Benefit
Current rates of capital investment do not keep up with Bloomington’s aging infrastructure and do not provide for large improvements to reduce main breaks overall. CBU plans to use these visualizations in future CBU budget presentations to show the need to allocate more money for things like pipe replacement. Risk calculations that inform capital project planning require upgrading as better information and data are available. By continuing to increase data collection methods and data quality, CBU analysis to determine impact drivers will lead to smarter allocation of resources.
Inspired by incorporation of data visualization in this most recent water main break study, CBU has started to streamline reporting procedures for most water issues, such as all public-reported leak notifications using open-source G-suite tools like Forms, App Script, and Document Studio. By using these tools, CBU has enhanced data collection and quality in order for operators to react to notifications and alerts more efficiently.
This story also highlights the fact that innovation does not necessarily need to start out with something being wrong - instead, this story started with the CBU Director noticing something different and being curious about why that was and what could be learned from it.
Metadata
City Department(s): City of Bloomington Utilities Administration and Engineering Divisions
City Point(s) of Contact: Jill Minor, Liberty Flora, Nola Hendon, Travis Zimmerman, Holly McLauchlin
Partner(s): N/A
Partner(s) Point(s) of Contact: N/A
Type of Innovation: Technical/Data Analysis
Date Implemented: May 2020