Page last updated on August 3, 2017 at 12:57 pm
For more information, please contact
Vic Kelson, City of Bloomington Utilities Director, 812-349-3650, [email protected]
CBU Reports June 2017 Disinfection Byproduct Levels
Bloomington, Ind. — The monthly disinfection byproduct (DBP) test results for June have been released. Concentrations of DBPs increased compared to the very low levels in the past year. Concentrations are still well below the maximum allowed concentrations.
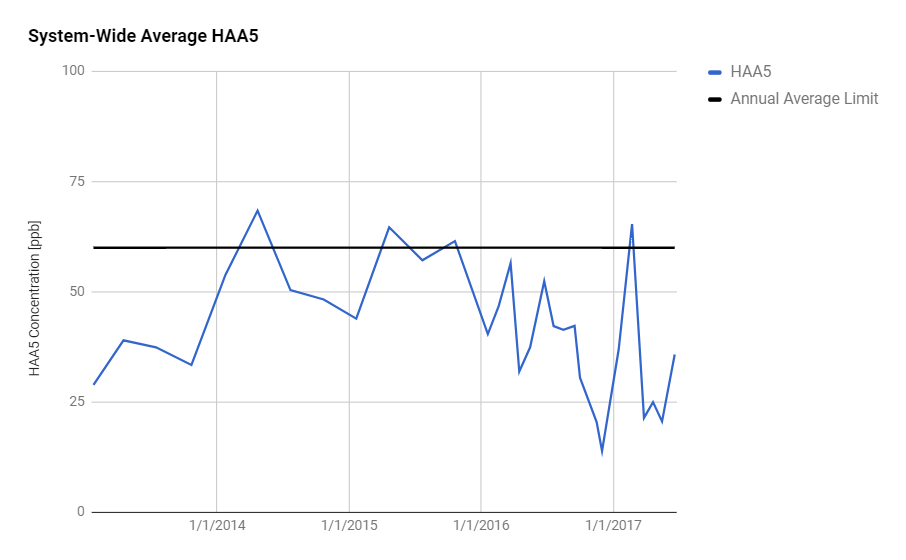
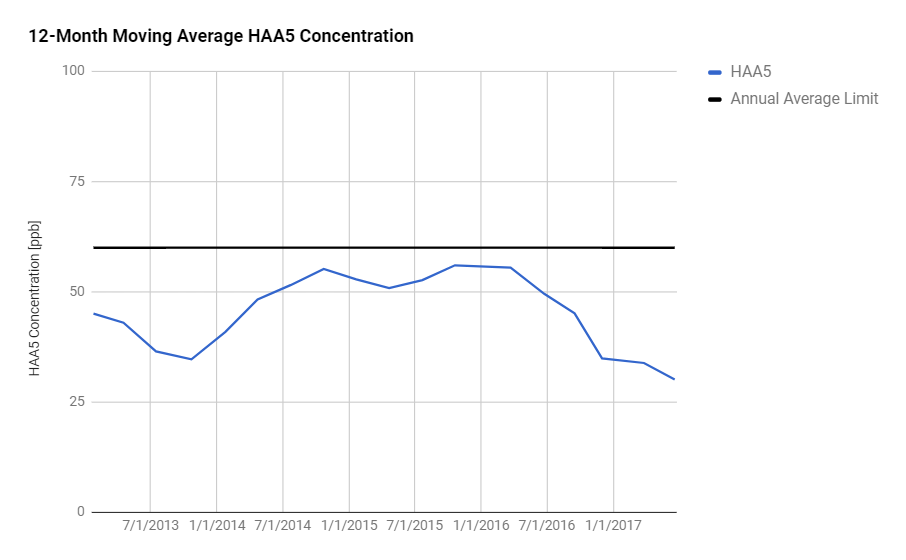
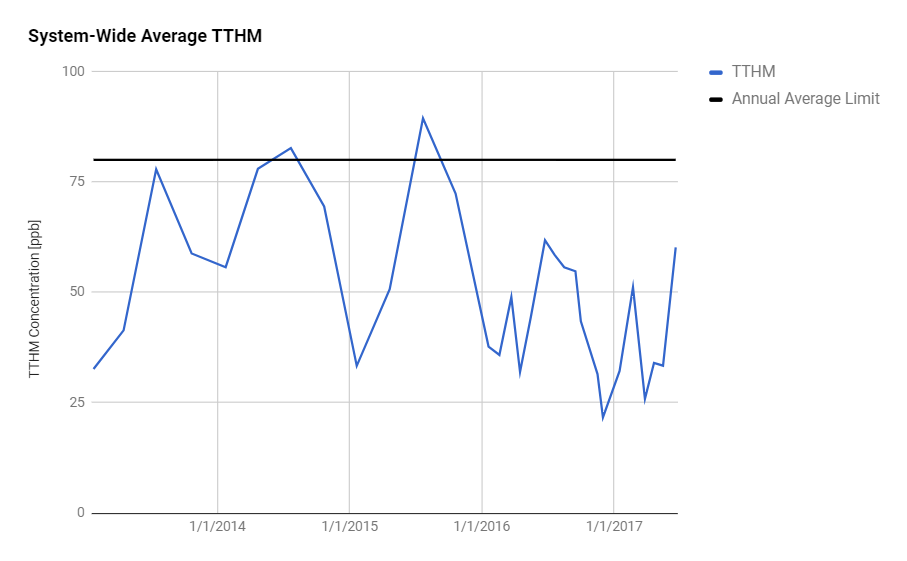
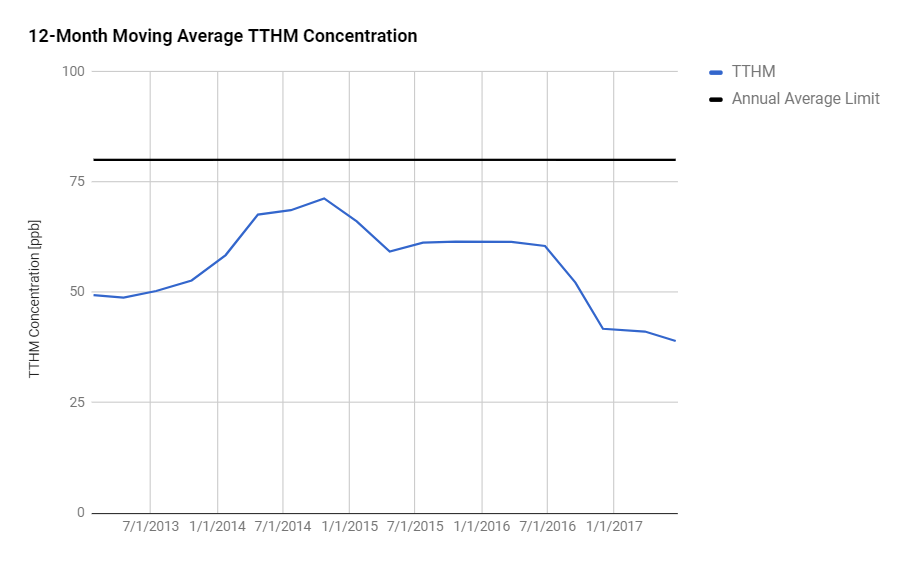
For June 2017, the measured concentration of haloacetic acid (HAA5) levels at the eight testing sites ranged from 24.1 parts per billion (ppb) to 38.6 ppb, the maximum allowed is 60 ppb. The trihalomethane (THM) levels were between 48.8 and 69.6 ppb, the maximum allowed is 80 ppb. In May 2017, results indicated the concentration of HAA5 ranged from 18.1 ppb to 21.8 ppb, and the THM levels were between 31.5 ppb and 35.2 ppb.
According to City of Bloomington Utilities Deputy Director John Langley, “Warmer weather causes more organic material in the water, to which the chlorine binds. It is typical to see increase in the summer months.”
In April 2016, CBU moved chlorination from the beginning to the end of the water treatment process in an effort to reduce DBPs, which has greatly reduced those testing numbers. This summer, all operators at the treatment plant have been trained to run calculations to help reduce DBPs in the finished water.
Regarding the report, Mayor John Hamilton said, “Utilities staff continues to work proactively to keep our DPB numbers well within allowable limits. Hot summers, and this year a warm spring, make those numbers more challenging to control, so we will continue to closely monitor and measure our progress.”
Monthly water testing was initiated in January 2016 in an effort to better track water quality, specifically DBPs. Since January 2016, no individual sample has exceeded the maximum contaminant level (MCL). In 2015, while there were no violations of the annual average standards, 8 of the 32 samples taken in the distribution system individually exceeded the THM standard and 12 of 32 exceeded the HAA5 standard. The graphs below show the recent results in comparison to prior years.
Testing of CBU water is conducted by a private, independent laboratory. All water quality test results are available online at data.bloomington.in.gov under “Utilities.”